大家好,我是张晋涛。
Prometheus 几乎已经成为了云原生时代下监控选型的事实标准,它也是第二个从 CNCF 毕业的项目。
当前,Prometheus 几乎可以满足各种场景/服务的监控需求。我之前有写过一些文章介绍过 Prometheus 及其生态,本篇我们将聚焦于 Prometheus 最新版本中发布的 Agent 模式,对于与此主题无关的一些概念或者用法,我会粗略带过。
拉模式(Pull)和 推模式(Push)
众所周知,Prometheus 是一种拉模式(Pull)的监控系统,这不同于传统的基于推模式(Push)的监控系统。
什么是拉模式(Pull)呢?

待监控的服务自身或者通过一些 exporter 暴露出来一些 metrics 指标的接口,由 Prometheus 去主动的定时进行抓取/采集,这就是拉模式(Pull)。即由监控系统主动的去拉(Pull)目标的 metrics。
与之相对应的就是推模式(Push)了。
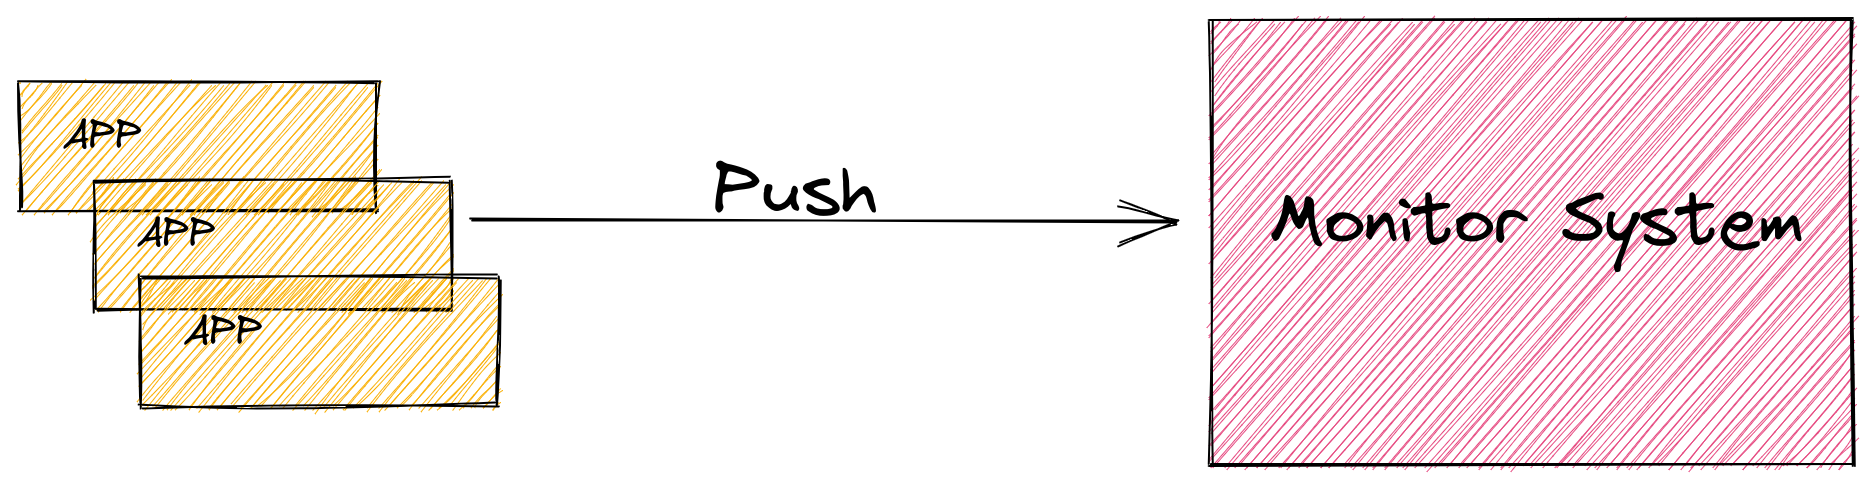
由应用程序主动将自身的一些 metrics 指标进行上报,监控系统再进行相对应的处理。如果对于某些应用程序的监控想要使用推模式(Push),比如:不易实现 metrics 接口等原因,可以考虑使用 Pushgateway 来完成。
对于拉模式(Pull)和推模式(Push)到底哪种更好的讨论一直都在继续,有兴趣的小伙伴可以自行搜索下。
这里主要是聚焦于单个 Prometheus 和应用服务之间交互的手方式。本篇我们从更上层的角度或者全局角度来看看当前 Prometheus 是如何做 HA、 持久化和集群的。
Prometheus HA/持久化/集群的方案
在大规模生产环境中使用时,很少有系统中仅有一个单实例 Prometheus 存在的情况出现。无论从高可用、数据持久化还是从为用户提供更易用的全局视图来考虑,运行多个 Prometheus 实例的情况就很常见了。
目前 Prometheus 主要有三种办法来将多个 Prometheus 实例的数据进行聚合,并给用户提供一个统一的全局视图。
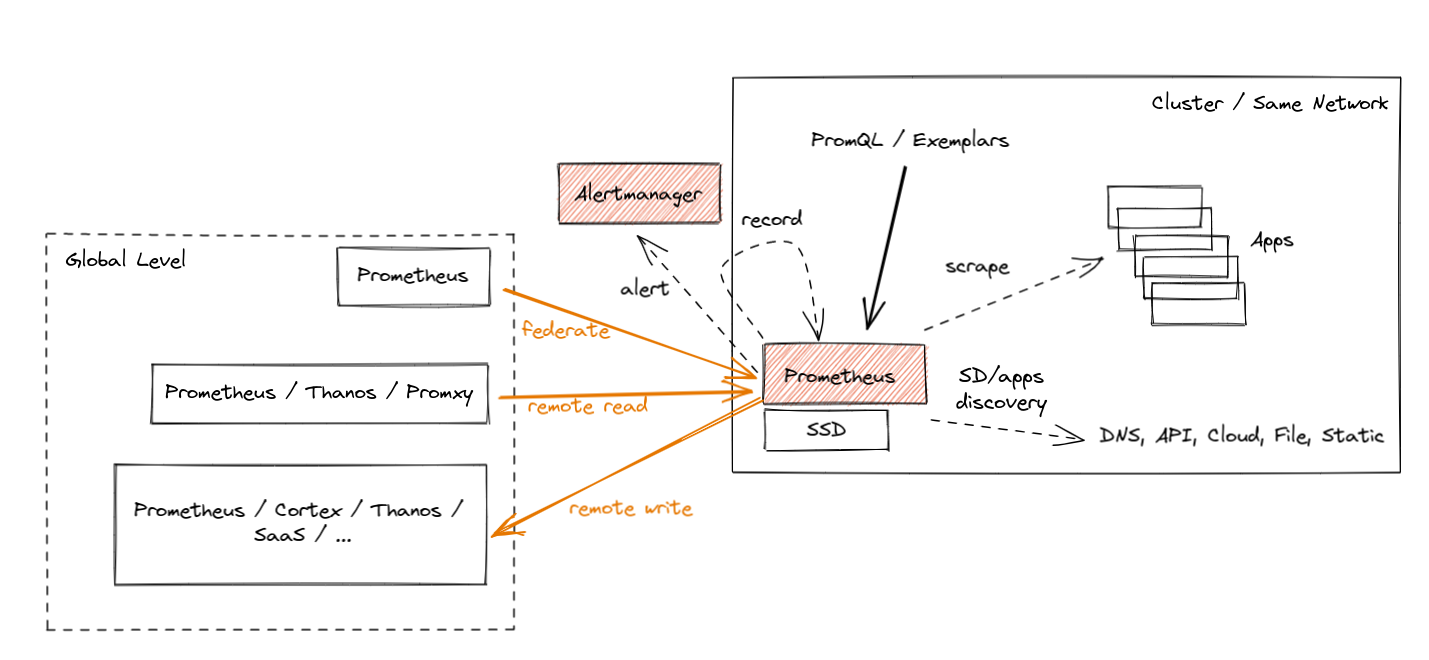
- 联邦(Federation):是最早期的 Prometheus 内置的数据聚合方案。这种方案下,可以使用某个中心 Prometheus 实例从叶子 Prometheus 实例上进行指标的抓取。这种方案下可以保留 metrics 原本的时间戳,整体也比较简单;
- Prometheus Remote Read(远程读):可以支持从远程的存储中读取原始 metrics,注意:这里的远程存储可以有多种选择。当读取完数据后,便可对它们进行聚合,并展现给用户了;
- Prometheus Remote Write(远程写):可以支持将 Prometheus 采集到 metrics 等写到远程存储中。用户在使用的时候,直接从远端存储中读取数据,并提供全局视图等;
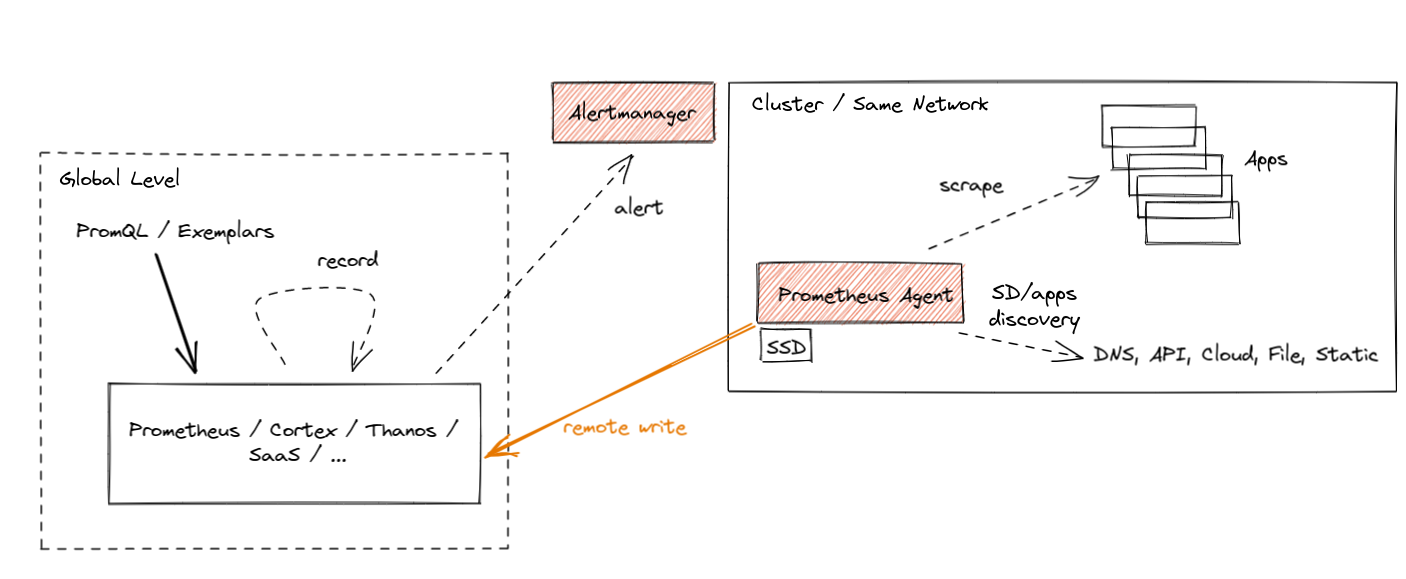
Prometheus Agent 模式
Prometheus Agent 是自 Prometheus v2.32.0 开始将会提供的一项功能,它主要是采用上文中提到的 Prometheus Remote Write 的方式,将启用了 Agent 模式的 Prometheus 实例的数据写入到远程存储中。并借助远程存储来提供一个全局视图。
前置依赖
由于它使用了 Prometheus Remote Write 的方式,所以我们需要先准备一个 “远程存储” 用于 metrcis 的中心化存储。这里我们使用 Thanos 来提供此能力。当然,如果你想要使用其他的方案,比如: Cortex、influxDB 等也都是可以的。
准备远程存储
这里我们直接使用 Thanos 最新版本的容器镜像来进行部署。这里我们使用了 host 网络比较方便进行测试。
执行完这些命令后,Thanos receive 将会监听在 http://127.0.0.1:10908/api/v1/receive 用于接收”远程写入”。
➜  cd prometheus
➜  prometheus docker run -d --rm \
    -v $(pwd)/receive-data:/receive/data \
    --net=host \
    --name receive \
    quay.io/thanos/thanos:v0.23.1 \
    receive \
    --tsdb.path "/receive/data" \
    --grpc-address 127.0.0.1:10907 \
    --http-address 127.0.0.1:10909 \
    --label "receive_replica=\"0\"" \
    --label "receive_cluster=\"moelove\"" \
    --remote-write.address 127.0.0.1:10908
59498d43291b705709b3f360d28af81d5a8daba11f5629bb11d6e07532feb8b6
➜  prometheus docker ps -l
CONTAINER ID   IMAGE                           COMMAND                  CREATED          STATUS          PORTS     NAMES
59498d43291b   quay.io/thanos/thanos:v0.23.1   "/bin/thanos receive…"   21 seconds ago   Up 20 seconds             receive
准备查询组件
接下来我们启动一个 Thanos 的 query 组件,跟 receive 组件连接,用于查询写入的数据。
➜  prometheus docker run -d --rm \
--net=host \
--name query \
quay.io/thanos/thanos:v0.23.1 \
query \
--http-address "0.0.0.0:39090" \
--store "127.0.0.1:10907"
10c2b1bf2375837dbda16d09cee43d95787243f6dcbee73f4159a21b12d36019
➜  prometheus docker ps -l
CONTAINER ID   IMAGE                           COMMAND                  CREATED         STATUS         PORTS     NAMES
10c2b1bf2375   quay.io/thanos/thanos:v0.23.1   "/bin/thanos query -…"   4 seconds ago   Up 3 seconds             query
注意:这里我们配置了 --store 字段,指向了前面的 receive 组件。
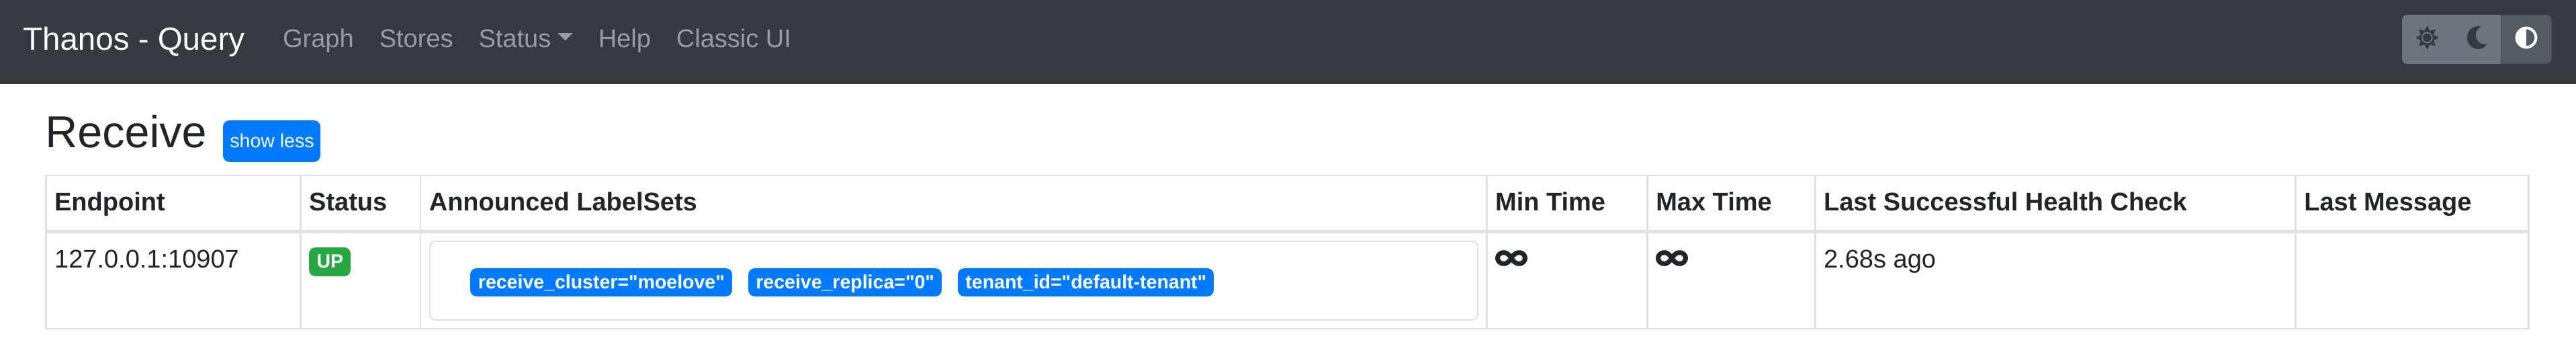
打开浏览器访问 http://127.0.0.1:39090/stores ,如果一起顺利,你应该可以看到 receive 已经注册到了 store 中。
部署 Prometheus Agent 模式
这里我直接从 Prometheus 的 Release 页面 下载了它最新版本 v2.32.0 的二进制文件。解压后,你会发现目录中的内容和之前版本中是一致的。
这是因为 Prometheus Agent 模式现在是内置在 Prometheus 二进制文件中的,增加 --enable-feature=agent 选项即可启用。
准备配置文件
我们需要为它准备一份配置文件,注意, 需要配置 remote_write ,且不能有 alerting 之类的配置
global:
  scrape_interval: 15s
  external_labels:
    cluster: moelove
    replica: 0

scrape_configs:
  - job_name: "prometheus"
    static_configs:
      - targets: ["localhost:9090"]

remote_write:
- url: 'http://127.0.0.1:10908/api/v1/receive'
配置文件另存为 prometheus.yml
启动
我们将它的日志级别设置成 debug 方便查看它的一些细节
➜  ./prometheus --enable-feature=agent --log.level=debug --config.file="prometheus.yml"
ts=2021-11-27T19:03:15.861Z caller=main.go:195 level=info msg="Experimental agent mode enabled."
ts=2021-11-27T19:03:15.861Z caller=main.go:515 level=info msg="Starting Prometheus" version="(version=2.32.0-beta.0, branch=HEAD, revision=c32725ba7873dbaa39c223410043430ffa5a26c0)"
ts=2021-11-27T19:03:15.861Z caller=main.go:520 level=info build_context="(go=go1.17.3, user=root@da630543d231, date=20211116-11:23:14)"
ts=2021-11-27T19:03:15.861Z caller=main.go:521 level=info host_details="(Linux 5.14.18-200.fc34.x86_64 #1 SMP Fri Nov 12 16:48:10 UTC 2021 x86_64 moelove (none))"
ts=2021-11-27T19:03:15.861Z caller=main.go:522 level=info fd_limits="(soft=1024, hard=524288)"
ts=2021-11-27T19:03:15.861Z caller=main.go:523 level=info vm_limits="(soft=unlimited, hard=unlimited)"
ts=2021-11-27T19:03:15.862Z caller=web.go:546 level=info component=web msg="Start listening for connections" address=0.0.0.0:9090
ts=2021-11-27T19:03:15.862Z caller=main.go:980 level=info msg="Starting WAL storage ..."
ts=2021-11-27T19:03:15.863Z caller=tls_config.go:195 level=info component=web msg="TLS is disabled." http2=false
ts=2021-11-27T19:03:15.864Z caller=db.go:306 level=info msg="replaying WAL, this may take a while" dir=data-agent/wal
ts=2021-11-27T19:03:15.864Z caller=db.go:357 level=info msg="WAL segment loaded" segment=0 maxSegment=0
ts=2021-11-27T19:03:15.864Z caller=main.go:1001 level=info fs_type=9123683e
ts=2021-11-27T19:03:15.864Z caller=main.go:1004 level=info msg="Agent WAL storage started"
ts=2021-11-27T19:03:15.864Z caller=main.go:1005 level=debug msg="Agent WAL storage options" WALSegmentSize=0B WALCompression=true StripeSize=0 TruncateFrequency=0s MinWALTime=0s MaxWALTime=0s
ts=2021-11-27T19:03:15.864Z caller=main.go:1129 level=info msg="Loading configuration file" filename=prometheus.yml
ts=2021-11-27T19:03:15.865Z caller=dedupe.go:112 component=remote level=info remote_name=e6fa2a url=http://127.0.0.1:10908/api/v1/receive msg="Starting WAL watcher" queue=e6fa2a
ts=2021-11-27T19:03:15.865Z caller=dedupe.go:112 component=remote level=info remote_name=e6fa2a url=http://127.0.0.1:10908/api/v1/receive msg="Starting scraped metadata watcher"
ts=2021-11-27T19:03:15.865Z caller=dedupe.go:112 component=remote level=info remote_name=e6fa2a url=http://127.0.0.1:10908/api/v1/receive msg="Replaying WAL" queue=e6fa2a
ts=2021-11-27T19:03:15.865Z caller=dedupe.go:112 component=remote level=debug remote_name=e6fa2a url=http://127.0.0.1:10908/api/v1/receive msg="Tailing WAL" lastCheckpoint= checkpointIndex=0 currentSegment=0 lastSegment=0
ts=2021-11-27T19:03:15.865Z caller=dedupe.go:112 component=remote level=debug remote_name=e6fa2a url=http://127.0.0.1:10908/api/v1/receive msg="Processing segment" currentSegment=0
ts=2021-11-27T19:03:15.877Z caller=manager.go:196 level=debug component="discovery manager scrape" msg="Starting provider" provider=static/0 subs=[prometheus]
ts=2021-11-27T19:03:15.877Z caller=main.go:1166 level=info msg="Completed loading of configuration file" filename=prometheus.yml totalDuration=12.433099ms db_storage=361ns remote_storage=323.413µs web_handler=247ns query_engine=157ns scrape=11.609215ms scrape_sd=248.024µs notify=3.216µs notify_sd=6.338µs rules=914ns
ts=2021-11-27T19:03:15.877Z caller=main.go:897 level=info msg="Server is ready to receive web requests."
ts=2021-11-27T19:03:15.877Z caller=manager.go:214 level=debug component="discovery manager scrape" msg="Discoverer channel closed" provider=static/0
ts=2021-11-27T19:03:28.196Z caller=dedupe.go:112 component=remote level=info remote_name=e6fa2a url=http://127.0.0.1:10908/api/v1/receive msg="Done replaying WAL" duration=12.331255772s
ts=2021-11-27T19:03:30.867Z caller=dedupe.go:112 component=remote level=debug remote_name=e6fa2a url=http://127.0.0.1:10908/api/v1/receive msg="runShard timer ticked, sending buffered data" samples=230 exemplars=0 shard=0
ts=2021-11-27T19:03:35.865Z caller=dedupe.go:112 component=remote level=debug remote_name=e6fa2a url=http://127.0.0.1:10908/api/v1/receive msg=QueueManager.calculateDesiredShards dataInRate=23 dataOutRate=23 dataKeptRatio=1 dataPendingRate=0 dataPending=0 dataOutDuration=0.0003201718 timePerSample=1.3920513043478261e-05 desiredShards=0.0003201718 highestSent=1.638039808e+09 highestRecv=1.638039808e+09
ts=2021-11-27T19:03:35.865Z caller=dedupe.go:112 component=remote level=debug remote_name=e6fa2a url=http://127.0.0.1:10908/api/v1/receive msg=QueueManager.updateShardsLoop lowerBound=0.7 desiredShards=0.0003201718 upperBound=1.3
ts=2021-11-27T19:03:45.866Z caller=dedupe.go:112 component=remote level=debug remote_name=e6fa2a url=http://127.0.0.1:10908/api/v1/receive msg=QueueManager.calculateDesiredShards dataInRate=23.7 dataOutRate=18.4 dataKeptRatio=1 dataPendingRate=5.300000000000001 dataPending=355.5 dataOutDuration=0.00025613744 timePerSample=1.3920513043478263e-05 desiredShards=0.00037940358300000006 highestSent=1.638039808e+09 highestRecv=1.638039823e+09
ts=2021-11-27T19:03:45.866Z caller=dedupe.go:112 component=remote level=debug remote_name=e6fa2a url=http://127.0.0.1:10908/api/v1/receive msg=QueueManager.updateShardsLoop lowerBound=0.7 desiredShards=0.00037940358300000006 upperBound=1.3
ts=2021-11-27T19:03:45.871Z caller=dedupe.go:112 component=remote level=debug remote_name=e6fa2a url=http://127.0.0.1:10908/api/v1/receive msg="runShard timer ticked, sending buffered data" samples=265 exemplars=0 shard=0
从日志中可以看到,它会去向 http://127.0.0.1:10908/api/v1/receive 也就是我们一开始部署的 Thanos receive 发送数据。
查询数据
打开我们一开始部署好的 Thanos query, 输入任意 metrics 进行查询,可以查询到预期的结果。
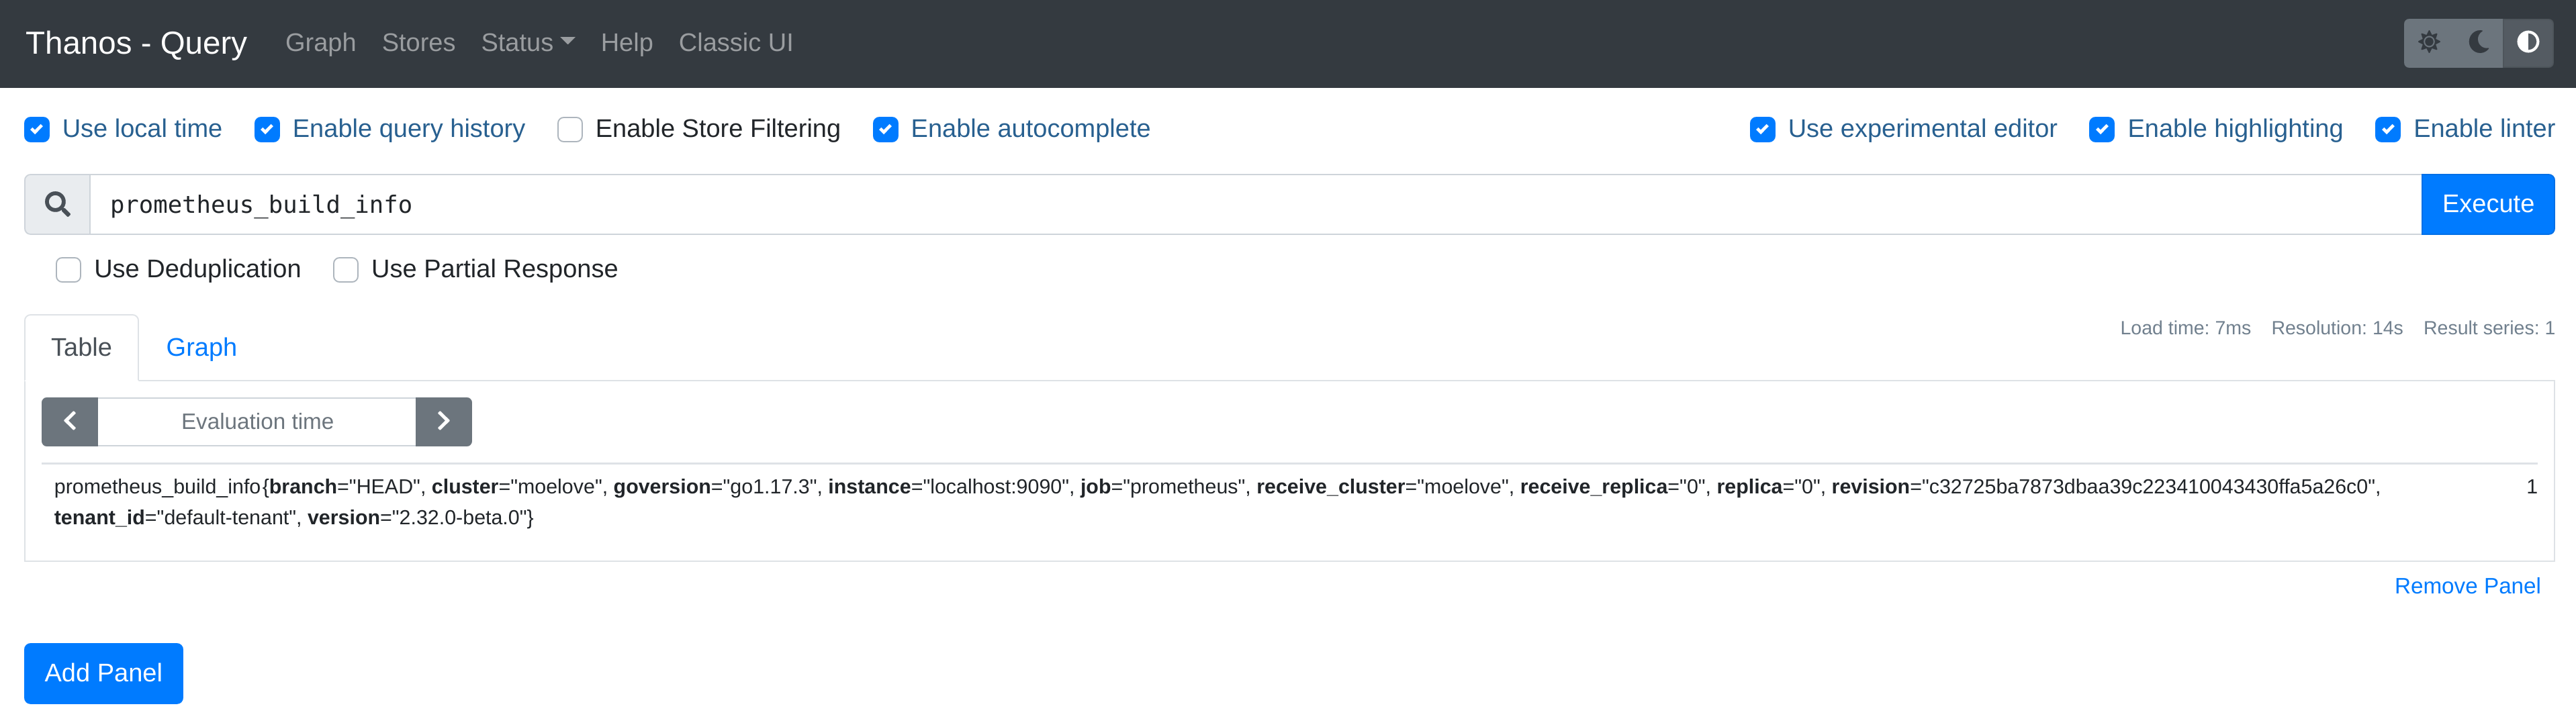
但是如果我们直接访问开启了 Agent 模式的 Prometheus 的 UI 地址的时候,会直接报错,无法进行查询。这是由于 如果已开启 Agent 模式的 Prometheus 将会默认关闭其 UI 查询能力,报警以及本地存储等能力。
总结
本篇主要进行了 Prometheus Agent 的上手实践,通过 Thanos receive 接收来自 Prometheus Agent 的 metrics 上报,然后通过 Thanos query 进行结果的查询。
Prometheus Agent 并没有本质上改变 Prometheus 指标采集的方式,仍然还是继续使用拉模式(Pull)。
它的使用场景主要是进行 Prometheus 的 HA/数据持久化或集群。与现有的一些方案在架构上会略有重合, 但是有一些优势:
- Agent 模式是 Prometheus 内置的功能;
- 开启 Agent 模式的 Prometheus 实例,资源消耗更少,功能也会更单一,对于扩展一些边缘场景更有利;
- 启用 Agent 模式后,Prometheus 实例几乎可以当作是一个无状态的应用,比较方便进行扩展使用;
过段时间就会发布正式版本了,你是否会尝试使用呢?
欢迎订阅我的文章公众号【MoeLove】

Comments